Monthly Archives: January 2020

Zero-contact recon: a game to hone target research skills

A few weeks ago I was researching an entity and wanted to be completely hands-off with my recon methods and see what I could still obtain. The answer was: a lot. A heck of a lot, some of it incredibly valuable from an attacker’s perspective. I had also had in the back of my mind an intent to come up with some interesting workshops that my good friends in the Bournemouth Uni Computing and Security Society could have fun with. From these seeds, an idea was born: challenge people to find as much as possible using these methods, awarding points based on a finding’s value from the perspective of an attacker. Although it’s still very much a work in progress, I thought it might be worth sketching out my idea for people to try it, and get feedback.

This is something I hope can be of use to many people – the relevance to the pentesting community is pretty clear, but I also want to encourage my homies on the blue team to try this. If you use these techniques against your own organisation it has the potential to be of massive benefit.

Preparation

Select a target entity with an internet presence. The game’s organisers should research this entity themselves first, both to get an idea of the potential answers that competitors might give and assist scoring, and possibly to produce a map of known systems so that the no-contact rule can be enforced.

Set up an environment suitable for monitoring the competitors’ traffic and enforcing the rule. This might consist of an access point with some firewall logging to identify anyone connecting to the target’s systems directly, but organisers can choose any other method they deem suitable. If you trust participants to respect the rules enough, you could just decide not to do this part. It’s probably a good idea to at least have a quiet place with decent internet where you won’t be disturbed for the duration, and enough space for all the people taking part.

I would suggest that all participants should have a Shodan account. For students, good news – free! (at least in the US and UK, I don’t know about other locations)

Other tools that competitors should probably brush up on are whois, dig, and of course google your favourite search engine.

Rules

Competitors have a fixed time period to discover and record information relevant to an attacker who might wish to break in to the target’s network. Points will be scored for each piece of information based on how useful it is to this task. The time period can be decided by the organisers, but I think between one and two hours is a sensible period. The highest score achieved in the time period wins.

At the end of the period, competitors must provide a list of all their discoveries. The list must include a description of how each was found or a link to the source, sufficient for the judges to validate the finding’s accuracy. If there is insufficient information to verifiy a discovery, it shall receive no points.

No active connection to the target’s networks is permitted; this includes the use of VPNs and open proxies. Making active connections will be penalised, either by a points deduction or disqualification, at the judges’ discretion.

Points

ItemScore
Domains other than the target’s primary domain1pt each
* if domain can be confirmed as internal AD domain3pts each
Subsidiaries (wholly or majority owned)1pt each
Joint ventures2pts each
Public FQDNs/hostnames1pt each
Internet exposed services
* per unique protocol presented externally1pt each
* per unique server software identified1pt each
* per framework or application running on server (e.g. presence of struts, coldfusion, weblogic, wordpress)3pts each
* each version with known vulnerability
* RCE10pts each
* other vulns3pts each
ASNs1pt each
Format of employees’ emails3pts
Internal hostname convention5pts
Internal hostnames2pts each
Internal username convention5 pts
Internal usernames2pts each
Configuration fails (e.g. exposed RDP/SMB/SQL/Elastic/AWS bucket)5pts each
Individual confidential documents on internet3pts each
Large archive or collection of confidential documents on internet8pts each
Vendor/product name of internal products relevant to security/intrusion (e.g. AV/proxy/reverse proxy/IDS/WAF in use)4pts each

Any items discovered that apply to a subsidiary or joint venture are valid and to be included in the score.

A little help?

I’m intending to playtest this as soon as possible, but I would absolutely love to get feedback, regardless of whether I’ve already tested it. Please comment or tweet at me (@http_error_418) with suggestions for how to improve it, more items that can be scored, criticism of points balance… anything!
tstats: afterburners for your Splunk threat hunting

Recently, @da_667 posted an excellent introduction to threat hunting in Splunk. The information in Sysmon EID 1 and Windows EID 4688 process execution events is invaluable for this task. Depending on your environment, however, you might find these searches frustratingly slow, especially if you are trying to look at a large time window. You may also have noticed that although these logs concern the same underlying event, you are using two different searches to find the same thing. Is there anything we can do to improve our searches? Spoiler: yes!

One of the biggest advantages Splunk grants is in the way it turns the traditional model of indexing SIEM events on its head. Instead of parsing all the fields from every event as they arrive for insertion into a behemoth of a SQL database, they decided it was far more efficient to just sort them by the originating host, source type, and time, and extract everything else on the fly when you search. It’s a superb model, but does come with some drawbacks.

Some searches that might have been fast in a database are not so rapid here. Again, because there is no database, you are not constrained to predefined fields set by the SIEM vendor – but there is nothing to keep fields with similar data having the same name, so every type of data has its own naming conventions. Putting together a search that covers three different sources for similar data can mean having to know three different field names, event codes specific to the products… it can get to be quite a hassle!

The answer to these problems is datamodels, and in particular, Splunk’s Common Information Model (CIM). Datamodels allow you to define a schema to address similar events across diverse sources. For example, instead of searching

index=wineventlog EventCode=4688 New_Process_Name="*powershell.exe" 

and

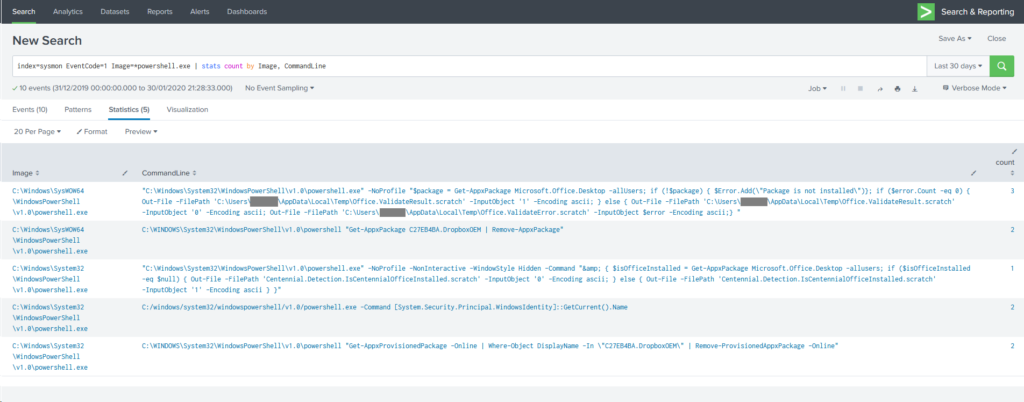
index=sysmon EventCode=1 Image=*powershell.exe 

separately, you can search the Endpoint.Processes datamodel for process_name=powershell.exe and get results for both. The CIM is a set of predefined datamodels for, as the name implies, types of information that are common. Once you have defined a datamodel and mapped a sourcetype to it, you can “accelerate” it, which generates indexes of the fields in the model. This process carries a storage, CPU and RAM cost and is not on by default, so you need to understand the implications before enabling it.

Turn it up to 11

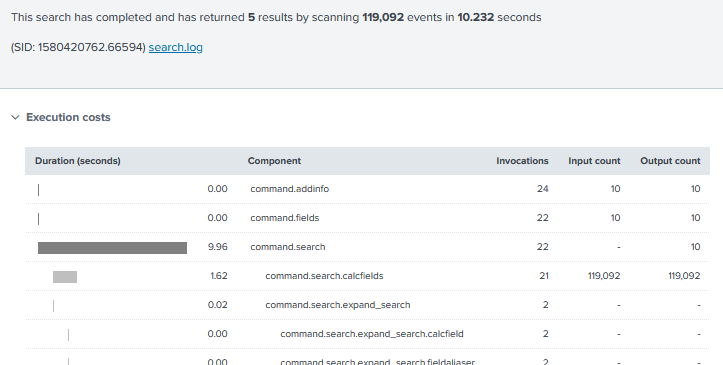
Let’s take this example, based on the fourth search in @da_667’s blog. In my (very limited) data set, according to the Job Inspector, it took 10.232 seconds to search 30 days’ worth of data. That’s not so bad, but I only have a few thousand events here, and you might be searching millions, or tens of millions – or more!

Splunk Job Inspector showing search time and cost breakdown

What happens if we try searching an accelerated datamodel instead? Is there much of a difference?

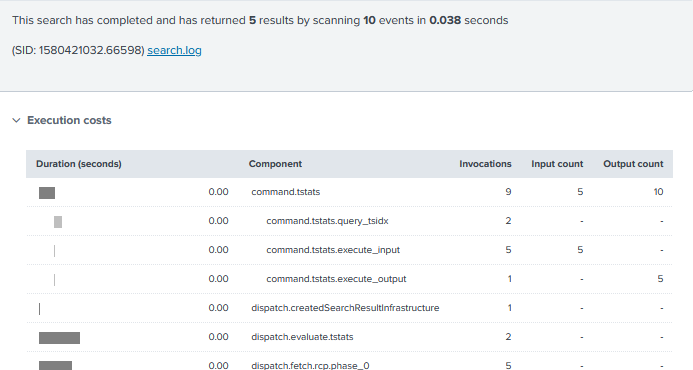
Splunk Job Inspector information for accelerated datamodel search

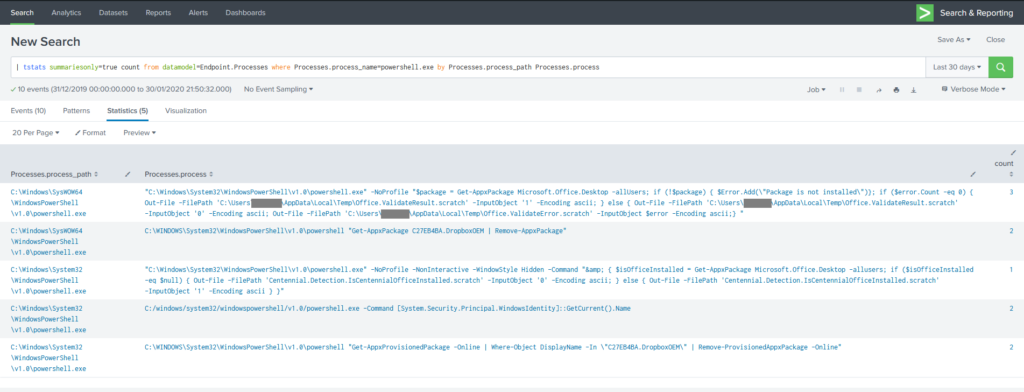
Holy shitballs yes it does. This search returned in 0.038 seconds, that’s nearly 270x faster! What sorcery is this? Well, the command used was:

| tstats summariesonly=true count from datamodel=Endpoint.Processes where Processes.process_name=powershell.exe by Processes.process_path Processes.process

What’s going on in this command? First of all, instead of going to a Splunk index and running all events that match the time range through filters to find “*.powershell.exe“, my tstats command is telling it to search just the tsidx files – the accelerated indexes mentioned earlier – related to the Endpoint datamodel. Part of the indexing operation has broken out the process name in to a separate field, so we can search for an explicit name rather than wildcarding the path.

The statistics argument count and the by clause work similarly to the traditional stats command, but you will note that the search specifies Processes.process_name – a quirk of the structure of data models means that where you are searching a subset of a datamodel (a dataset in Splunk parlance), you need to specify your search in the form

datamodel=DatamodelName[.DatasetName] where [DatasetName.]field_name=somevalue by [DatasetName.]field2_name [DatasetName.]field3_name

The DatasetName components are not always needed – it depends whether you’re searching fields that are part of the root datamodel or not (it took me ages to get the hang of this so please don’t feel stupid if you’re struggling with it).

Filtered, like my coffee

Just as with the Hurricane Labs blog, options for filtering and manipulating tstats output can be managed with the same operations.

| tstats summariesonly=true count from datamodel=Endpoint.Processes where Processes.process_name=powershell.exe NOT Processes.parent_process_name IN ("code.exe", "officeclicktorun.exe") by Processes.process_path Processes.process | `drop_dm_object_name("Processes")`

You can filter on any of the fields present in the data model, and also by time, and the original index and sourcetype. The resulting data can be piped to whatever other manipulation/visualisation commands you want, which is particularly handy for charts and other dashboard features – your dashboards will be vastly sped up if you can base them on tstats searches.

You’ll also note the macro drop_dm_object_name – this reformats the field names to exclude the Processes prefix, which is handy when you want to manipulate the data further as it makes the field names simpler to reference.

A need for speed

How do I get me some of this sweet, sweet acceleration I hear you ask? The first thing to understand is that it needs to be done carefully. You will see an increase in CPU and I/O on your indexers and search heads. This is because the method involves the search head running background searches that populate the index. There will be a noticeable increase in storage use, with the amount depending on the summary range (i.e. time period covered by detailed indexing) and how busy your data sources are.

With this in mind, you can start looking at the Common Information Model app and the documentation on accelerating data models. I highly recommend consulting Splunk’s Professional Services before forging ahead, unless your admins are particularly experienced. The basic process is as follows:

  • Ensure that your sourcetypes are CIM compliant. For most Splunk-supported apps, this is already done.
  • Ensure that you have sufficient resources to handle the increased load
  • Deploy the CIM app
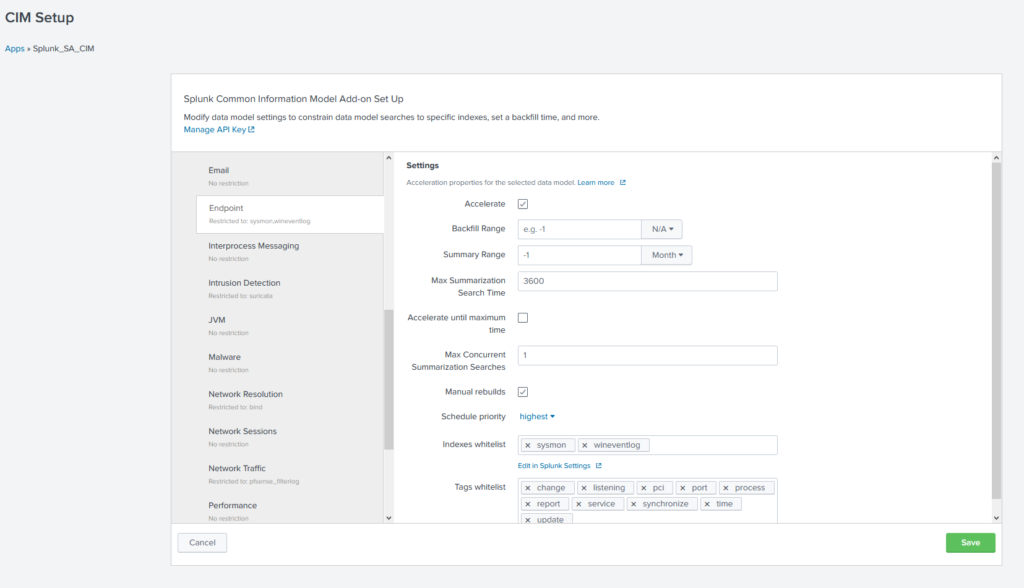
  • Enable acceleration for the desired datamodels, and specify the indexes to be included (blank = all indexes. Inefficient – do not do this)
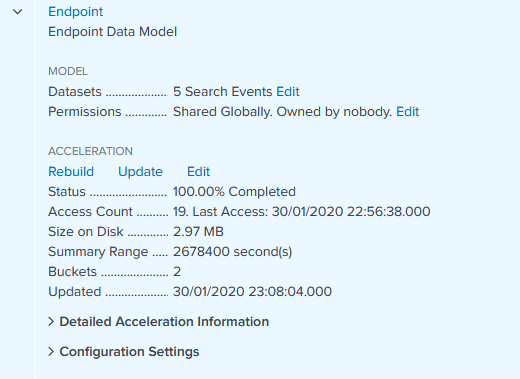
  • Wait for the summary indexes to build – you can view progress in Settings > Data models
  • Start your glorious tstats journey
Configuration for Endpoint datamodel in Splunk CIM app
Detail from Settings > Data models

Datamodels are hugely powerful and if you skim through the documentation you will see they can be applied to far more than just process execution. You can gather all of your IDS platforms under one roof, no matter the vendor. Get email logs from both Exchange and another platform? No problem! One search for all your email! One search for all your proxy logs, inbound and outbound! Endless possibilities are yours.

One search to rule them all, one search to find them… happy Splunking!