I run a home lab, with a bunch of VMs running vaguely security-related tools, with a PFSense router in front of everything. On PFSense, I am running Suricata on several interfaces. I also collect the data in to a Splunk instance (❤️ developer license).
The Problem
You can forward data into Splunk with syslog. Ingesting syslog in to Splunk is not the easiest way to collect data – ideally you want to use a Splunk Universal Forwarder – (n.b. do not configure Splunk indexers or forwarders to listen for syslog directly! Use a dedicated syslog server!), but PFSense can forward its syslog natively, and Suricata alerts get written to syslog – so why not use that?
Well, because the data that Suricata puts in a syslog event is next to useless.
02/28/2023-20:18:38.695473 [**] [1:2016683:3] ET WEB_SERVER WebShell Generic - wget http - POST [**] [Classification: Potentially Bad Traffic] [Priority: 2] {TCP} 118.232.97.242:56937 -> <REDACTED>:80A signature name, a source, and a destination. That’s it. Nothing to really let you understand what was happening underneath. What you really want is the Suricata eve.json output, which PFSense very helpfully allows you to enable. This contains a wealth of data, like the raw packet (in base64), decoded protocol elements like HTTP request headers, the URL, a DNS query – but although you can view these in the PFSense web UI, they are not covered by the native log management. What else could we use?
Splunk is easiest when you use a Splunk forwarder. Always use one when you can! However, sometimes it’s not the right choice… technically you can run the Forwarder on PFSense, as it’s FreeBSD, and there is a FreeBSD build of the forwarder. However, it has some drawbacks: you’ll find that although you appear to be able to enable boot-start, it doesn’t actually work. PFSense manages the set of services that run at boot and anything that is not an official PFSense package won’t get started. I’d been running it like this for ages, and given that I only rebooted my firewall once every six months or so, it was only a minor headache. If you’re running it as a production box though, that’s very much not ideal!
So, syslog is out, and a Splunk forwarder is problematic. What next?
Enter syslog-ng
PFSense is extensible, with a number of officially maintained add-on packages. Suricata is one. Another is the versatile syslog management engine, syslog-ng. Almost any way you can imagine of moving a log from one place to another, syslog-ng can do it for you. It could certainly scoop up files that aren’t covered by PFSense’s default syslog forwarding, and send them over to a syslog receiver. But. But.
syslog-ng can also write directly to the Splunk HTTP Event Collector (HEC). In fact, this is exactly what the Splunk Connect 4 Syslog package is under the hood – syslog-ng with a bunch of wrapping around it to make configuring it for a large number of Splunk inputs a bit less work. We don’t have that handy wrapping in PFSense, but it will absolutely let us do the necessary config manually, using an officially PFSense supported method. This post is therefore a step-by-step on how to set that up.
1. Groundwork
1.1 Splunk
You will need to have Splunk HEC set up. This part is covered by Splunk training (look in particular at the System Admin, Data Admin, and Architecting courses) and documentation so I will not rehash it here. However, as a brief summary, you will need to:
- enable HEC and generate tokens
- configure a load balancer (this is a non-Splunk item, but it is a critical step if you have a Splunk deployment with multiple indexers; do not direct HEC output at just one indexer in a cluster, it will do bad things to your Splunk deployment)
Tokens for a single-instance deployment can be found in Settings > Data Inputs > HTTP Event Collector. A HEC token looks like this in Splunk Web:

Consult the documentation linked above for information about how to obtain the token if set up in a distributed deployment.
1.2 PFSense
- Go to the System > Package Manager screen, search for the syslog-ng package, and install it
1.3 Network
Your PFSense device needs to be able to connect to the address of the HEC endpoint, on the appropriate port. The default port Splunk uses for this purpose is 8088. If using a load balancer, it must be able to connect to all Splunk indexers on the relevant port, and your PFSense device must also be able to connect to the load balancer. Test both of these things before starting to configure syslog-ng.
If you are intending to use a hostname to specify the Splunk instance / load balancer address, make sure that PFSense can resolve the hostname.
2. Configure syslog-ng
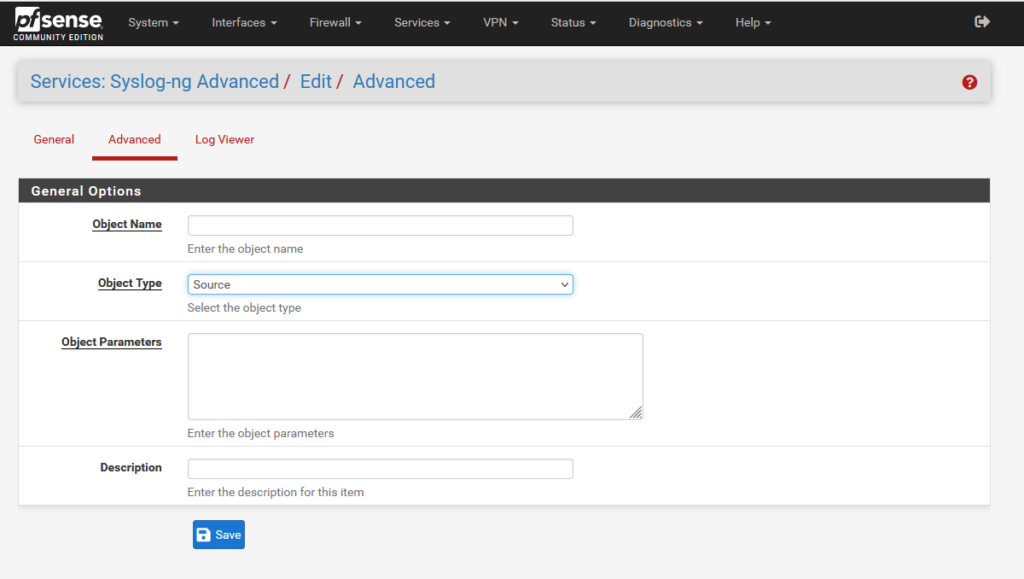
The most basic syslog-ng configuration has 3 components: a source, a destination, and a log directive that instructs syslog-ng to send source X to destination Y. The configuration needed for this use case is only a few minor tweaks away from this baseline. To begin configuring, navigate to Services > syslog-ng in the PFSense admin interface. You quite likely will not need to alter anything under the General tab. Configuring specific logging settings is done under the Advanced tab. Click Add to start writing a config.
2.1 The source
The “Object Type” for a source must be… Source. Sorry, no prizes for guessing that one.

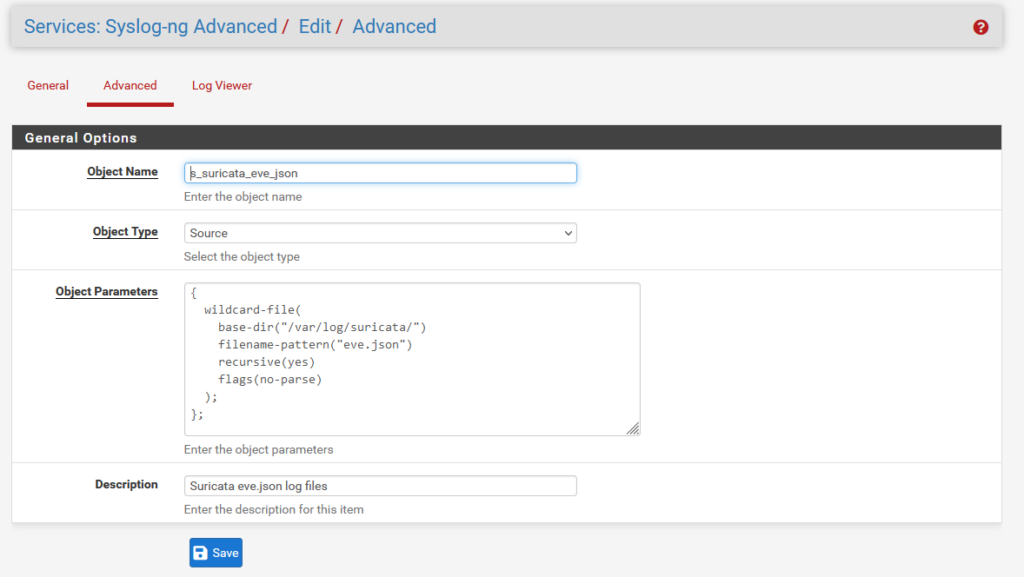
The “Object Name” is a unique identifier for the config stanza you are defining. There are few strict limitations, but it is a recommended convention to prefix source config names with “s_”, destination names with “d_” etc. The remainder should be brief, but descriptive. This config is to read the Suricata eve.json log files, so I have named it “s_suricata_eve_json”.
The “Object Parameters” define what is actually going to happen. To determine what to set, we must understand where and how the data we want to send exists.
PFsense stores Suricata logs in /var/log/suricata. It can run multiple instances of Suricata, one for each firewall interface. Every instance of Suricata gets its own directory within this path, and the logs are in these subdirectories.

We could write a separate source stanza for each individual file, manually specifying the interface name. However, that way you would need to edit the config whenever you set Suricata on a new interface. We can instead watch all the directories at once.

The wildcard-file option allows collecting multiple files, and can recursively search directories from a specified base path. That’s perfect for our use case. We specify the base-dir option to /var/log/suricata, set recursion to “yes”, and read all files named “eve.json”.
Additionally, the “no-parse” flag is set. This is because the default behaviour of syslog-ng is to attempt to interpret all messages as RFC-compliant syslog messages, where there is a set of default header fields such as syslog priority, timestamp, and host. Suricata eve.json events consist of a JSON object, with no header; trying to parse a syslog header from this results in improperly formatted JSON (and we need it to be valid JSON when it is sent to Splunk). This is the resulting definition:
{
  wildcard-file(
    base-dir("/var/log/suricata/")
    filename-pattern("eve.json")
    recursive(yes)
    flags(no-parse)
  );
};
Write a brief description, save this configuration, then click Add again for the next one.
2.2 The destination
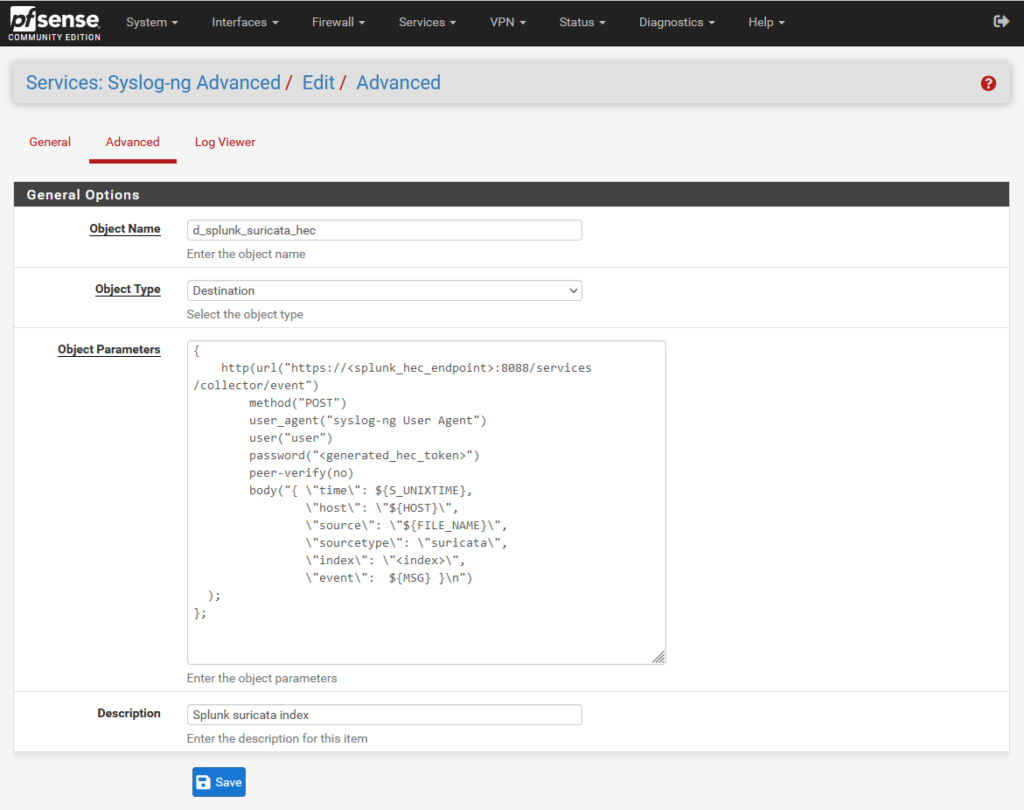
You need to direct the events which are found in the source to your Splunk HEC receiver. Set the “Object Type” as “Destination”. My destination is labelled “d_splunk_suricata_hec”.
The syslog-ng option that allows sending data to HEC is the http() function. In this function we will define the destination (HEC endpoint host and the path “/services/collector/event” which is where Splunk HEC listener receives data), the token generated in step 1.1, and the HTTP body. The body is a JSON object with a specific set of fields that Splunk expects.

You must replace several elements of this with values specific to your environment:
- <splunk_hec_endpoint> should be the IP or hostname of your load balancer, or of the Splunk instance if it is an all-in-one instance
- <generated_hec_token> should be replaced with the token generated in step 1.1
- In an ideal environment, you will be using proper certificate management with PKI; instead of setting peer-verify(no), you would load your organisation’s certificates into PFSense
- <index> should be changed to the Splunk index you wish the logs to be sent to
After changing the values it should look something like this:
{
    http(url("https://172.16.3.9:8088/services/collector/event")
        method("POST")
        user_agent("syslog-ng User Agent")
        user("user")
        password("eb2cb049-3091-4b82-af1e-da11349a5e2b")
        peer-verify(no)
        body("{ \"time\": ${S_UNIXTIME},
                \"host\": \"${HOST}\",
                \"source\": \"${FILE_NAME}\",
                \"sourcetype\": \"suricata\",
                \"index\": \"suricata\",
                \"event\":  ${MSG} }\n")
  );
};
Write a brief Description, save the configuration, and click Add to start writing the final part.
2.3 The log directive
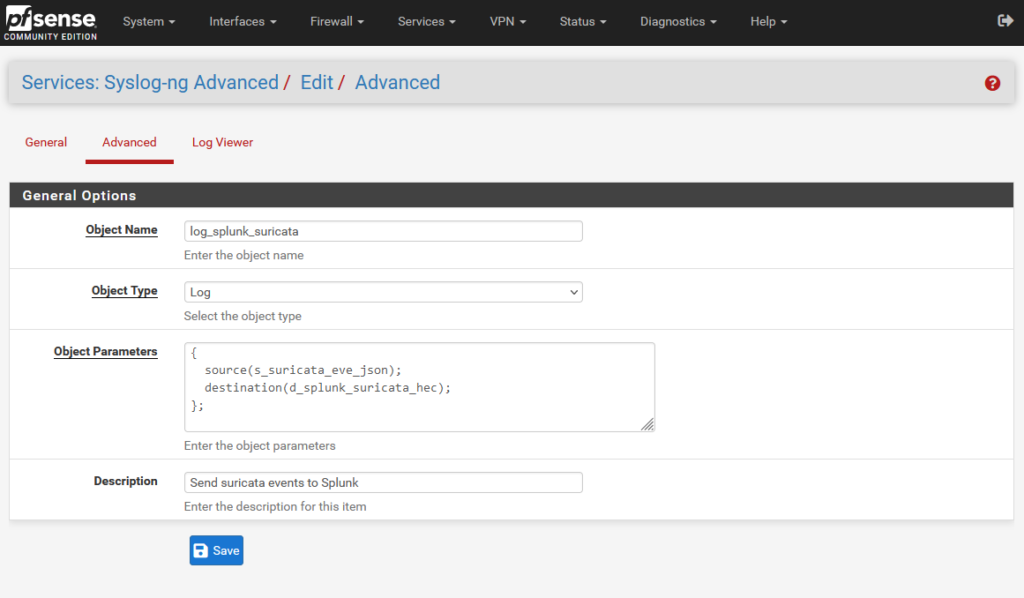
Now that a source and destination have been defined, they can be connected together with a third stanza, where the “Object Type” is “Log”. This is the simplest of the three, and looks like so:

The source() function uses the Object Name chosen in step 2.1; the destination() function takes the name chosen in 2.2. Add these in, set an object name and description for this stanza, and save – and you should be rolling!
{
  source(s_suricata_eve_json);
  destination(d_splunk_suricata_hec);
};
3. Checking your work
The first place to look is in the index you set as destination for Suricata events. Depending on how busy the device is, you might get dozens of events a minute, or only a few per hour. If you don’t see anything, try looking in the following places to see why:
3.1 Suricata logs on PFSense
You can see the events as they are written on the device under Services > Suricata > Logs View. If you have command line access you can also look in the filesystem at /var/log/suricata/<interface name>/eve.json.
3.2 syslog-ng logs on PFSense
Under Services > syslog-ng > Log Viewer, you can see recent messages from the syslog-ng service. Possible errors you could see here, and their causes include:
error sending HTTP request; url='https://<your host>:8088/services/collector/event', error='Couldn\'t resolve host name'
PFSense could not look up the specified hostname via DNS; redo step 1.3
curl: error sending HTTP request; url='https://<your host>:8088/services/collector/event', error='SSL peer certificate or SSH remote key was not OK'
the certificate is not trusted – you should specify peer-verify(no) if this is expected
Server returned with a 4XX (client errors) status code, which means we are not authorized or the URL is not found.; url='https://<your host>:8088/services/collector/event', status_code='400'
the request wasn’t formatted correctly; you may have made a typo when constructing the text in the body() function
3.3 HEC logs in Splunk
If syslog-ng connects successfully but submits bad information, Splunk HEC will log an error. You can search for this with:
index=_internal component=HttpInputDataHandlerIf the problem is badly formatted data, the messages aren’t hugely informative, but they are at least enough to confirm roughly what’s going on.
10-11-2023 20:31:45.580 +0100 ERROR HttpInputDataHandler [23746 HttpDedicatedIoThread-0] - Failed processing http input, token name=pfsense_syslog_ng, channel=n/a, source_IP=<syslog-ng source IP>, reply=6, events_processed=0, http_input_body_size=1046, parsing_err="While expecting event object key: Unexpected character: ':', totalRequestSize=1046"
When I encountered this, the only way I could think of to see what the problem was, was to write a second destination for syslog-ng where it would write events to a new file, using the same formatting text used in the body() function of the http() destination. I could then read the file and figure out which bit of the JSON was incorrect.
Hopefully now that I’ve shown exactly which bits to alter in this guide, you won’t have a need for that level of debugging! If you find messages like this, first re-read section 2.2 and check your destination stanza very carefuly against the example, for missing or extra characters.
4. Wrap up
If all went well, you now have all the eve.json events in Splunk, in all their lovely detail. If this has been helpful, I’d love to hear from you – or if there’s anything wrong or missing, please let me know. Happy Splunking!